Services
Operations dashboards for professional services. Strategy to delivery.
I build the dashboards that give agencies, consultancies, law firms and accountancy practices real-time grip on utilization, margins, and pipeline. One consultant, no handoffs, no agency overhead.
BI Strategy
Define which operational metrics actually drive your firm before touching any tool. Strategy first.
- Define your 'True North' KPIs — utilization, project margin, pipeline health, capacity
- Audit your current data landscape — time tracking, CRM, accounting, project tools
- Design a roadmap from scattered spreadsheets to Single Source of Truth
- Align partners and management before implementation begins
- Technology selection: Looker Studio, BigQuery, Metabase — whatever fits your firm
Data Engineering
Automated pipelines that connect your time tracking, CRM, accounting, and project tools into one reliable data warehouse.
- Connect Teamleader, Exact Online, HubSpot, Productive, Jira — and anything with an API
- Data warehouse design and build in Google BigQuery
- Automated daily refresh — no manual exports, no stale spreadsheets
- AI-enhanced development — faster builds without compromising quality
- Documentation and handover so your team (or a junior) can maintain it
KPI Dashboards
Operations dashboards that show utilization, project margins, pipeline, and capacity — updated automatically, used daily.
- Utilization dashboards — billable vs. non-billable per team, department, individual
- Project profitability — margin per project, per client, per service line
- Pipeline & capacity planning — forecast workload before it becomes a problem
- Built in Metabase, Looker Studio, or your preferred platform
- Typical result: 60%+ reduction in manual reporting time
What you actually get
Five dashboards that replace your spreadsheets. Live data, updated automatically, built for how your firm actually works.
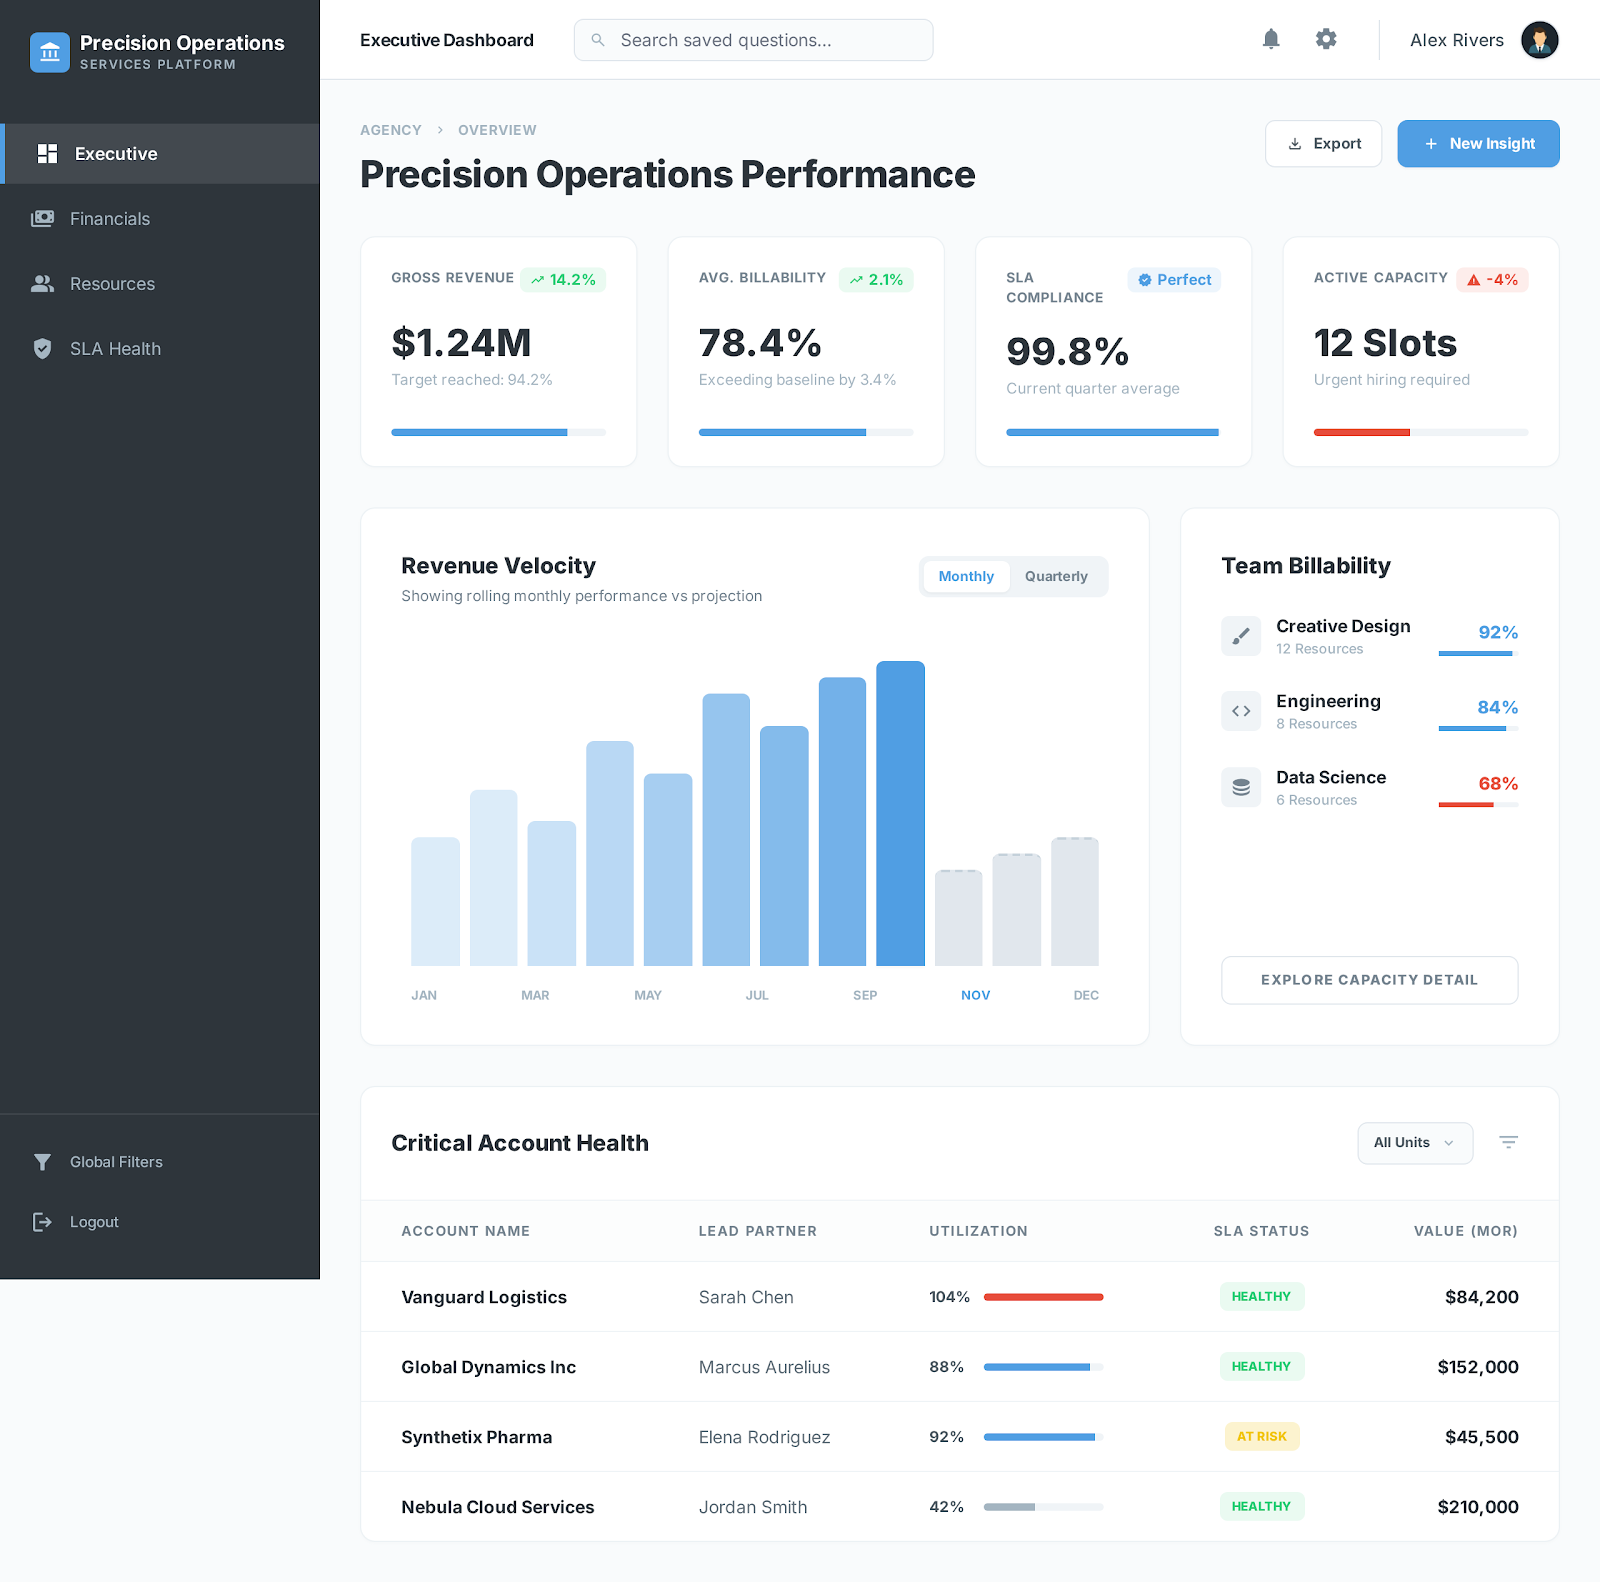
Executive Overview
Revenue, billability, SLA compliance and capacity — one screen.
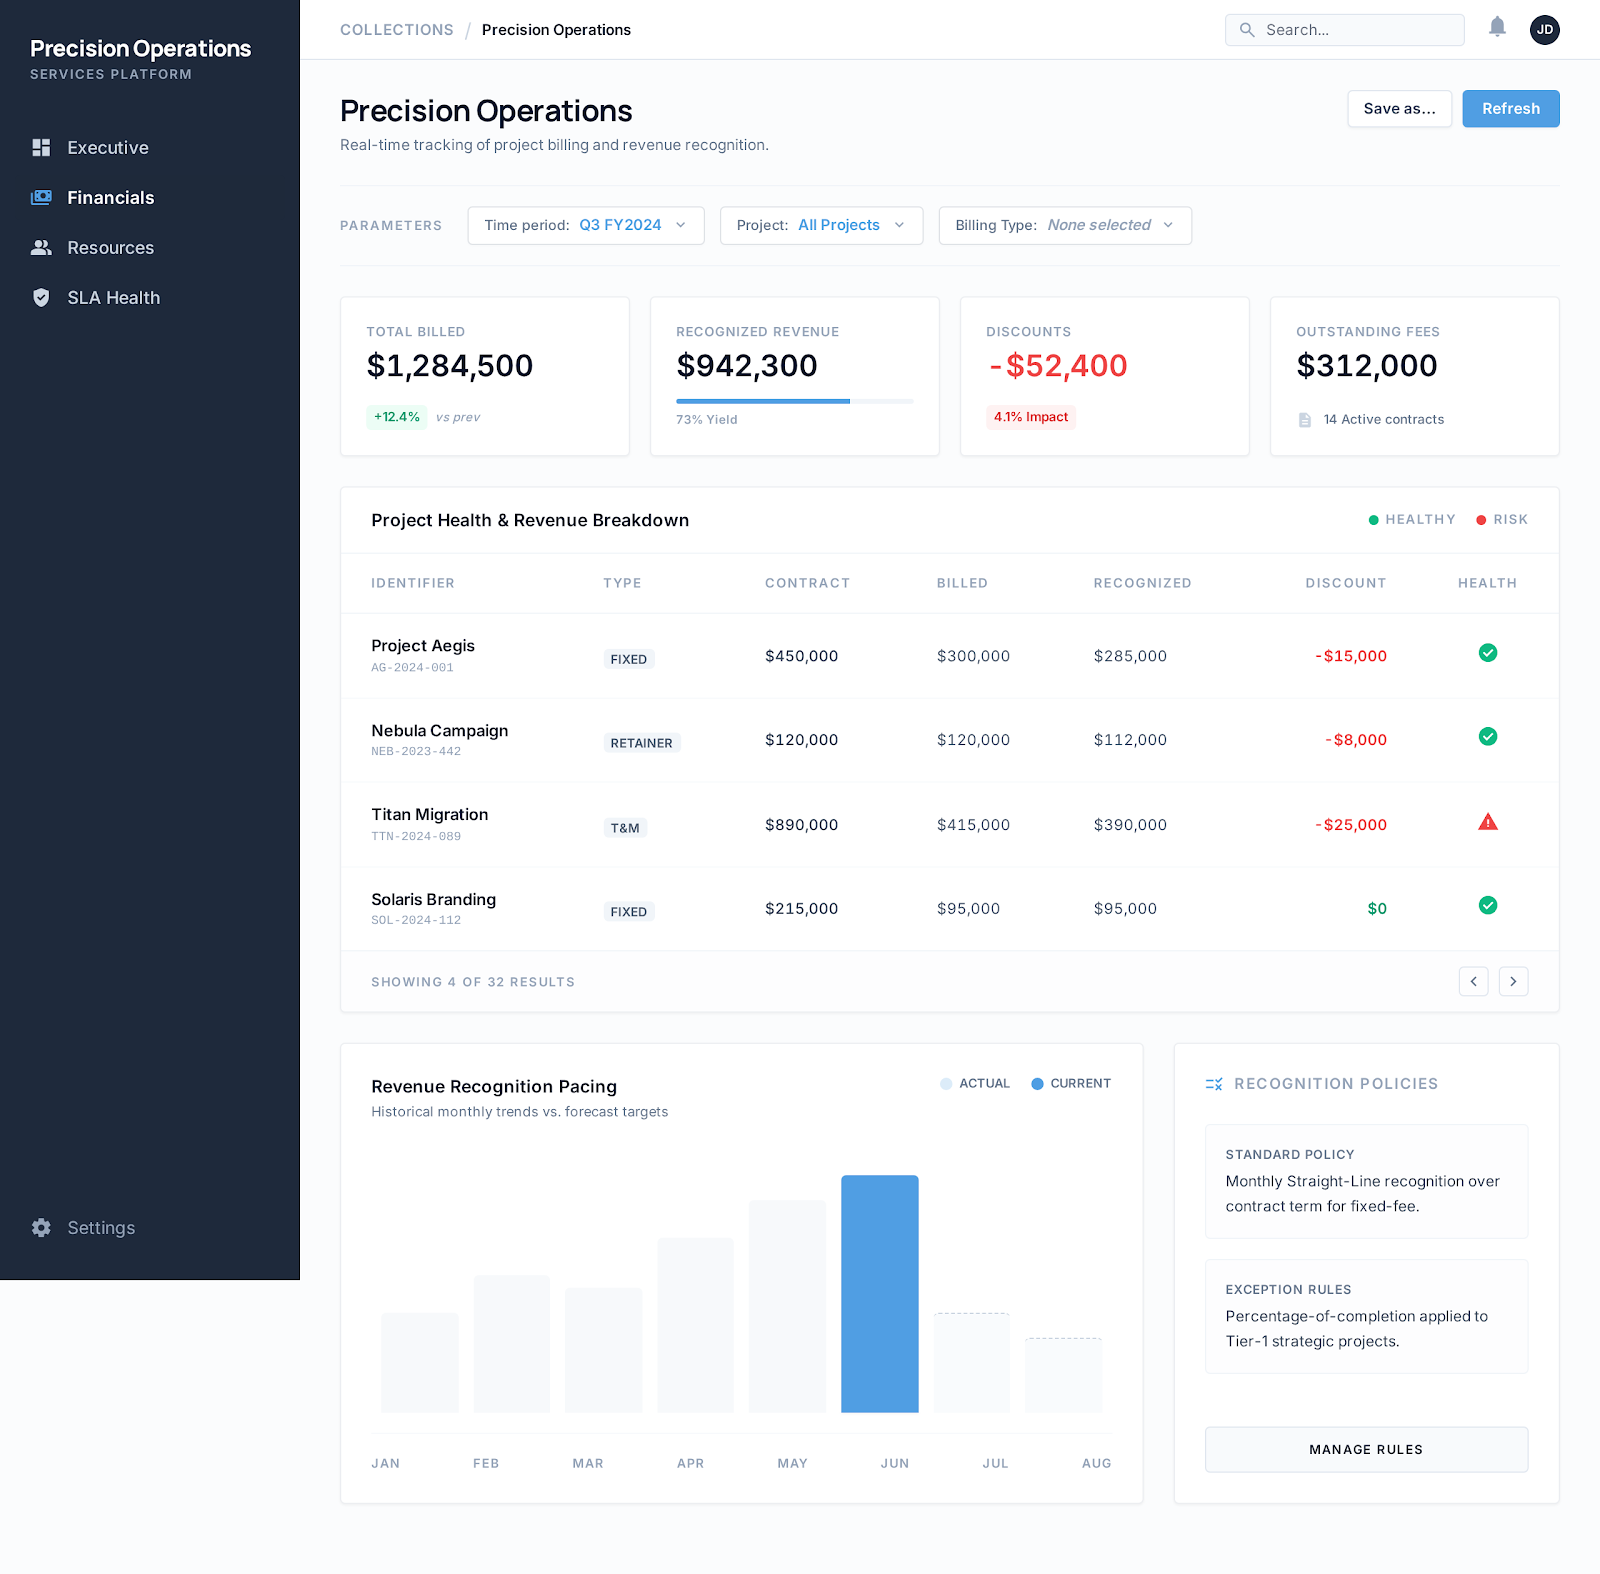
Project Financials
Margin per project, revenue recognition, billing health.
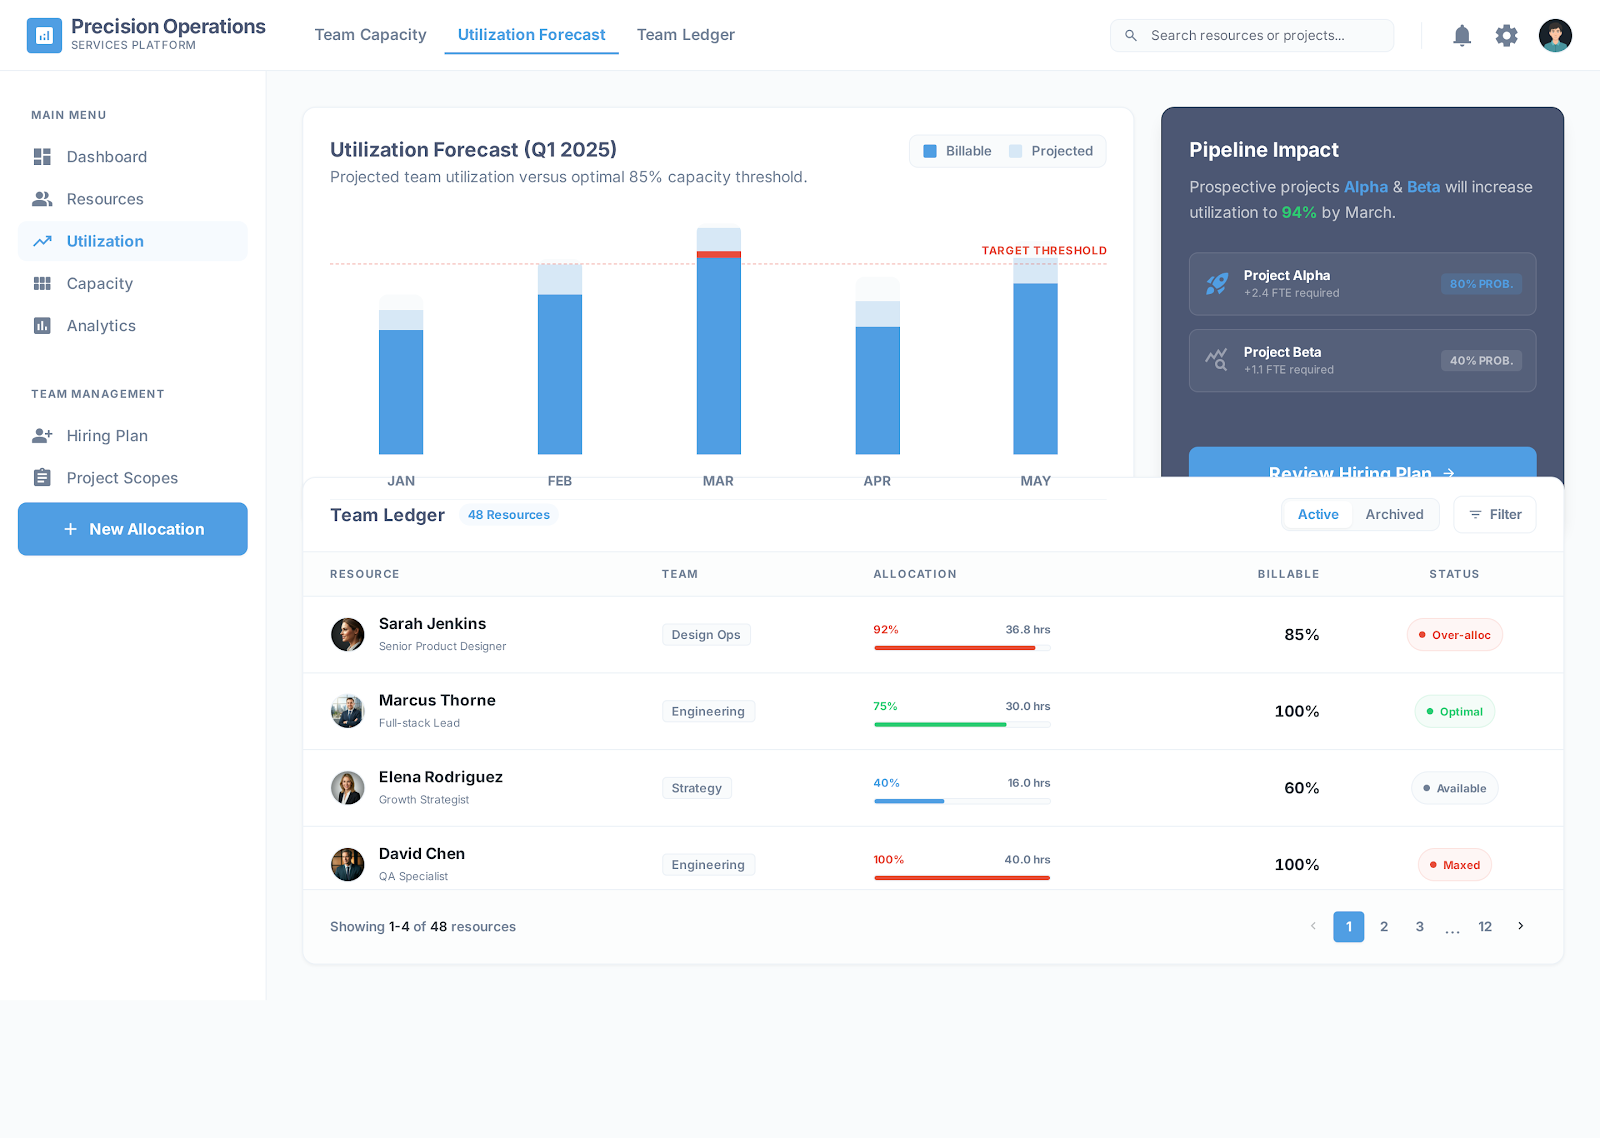
Utilization Forecast
Projected utilization vs. target, with pipeline impact.
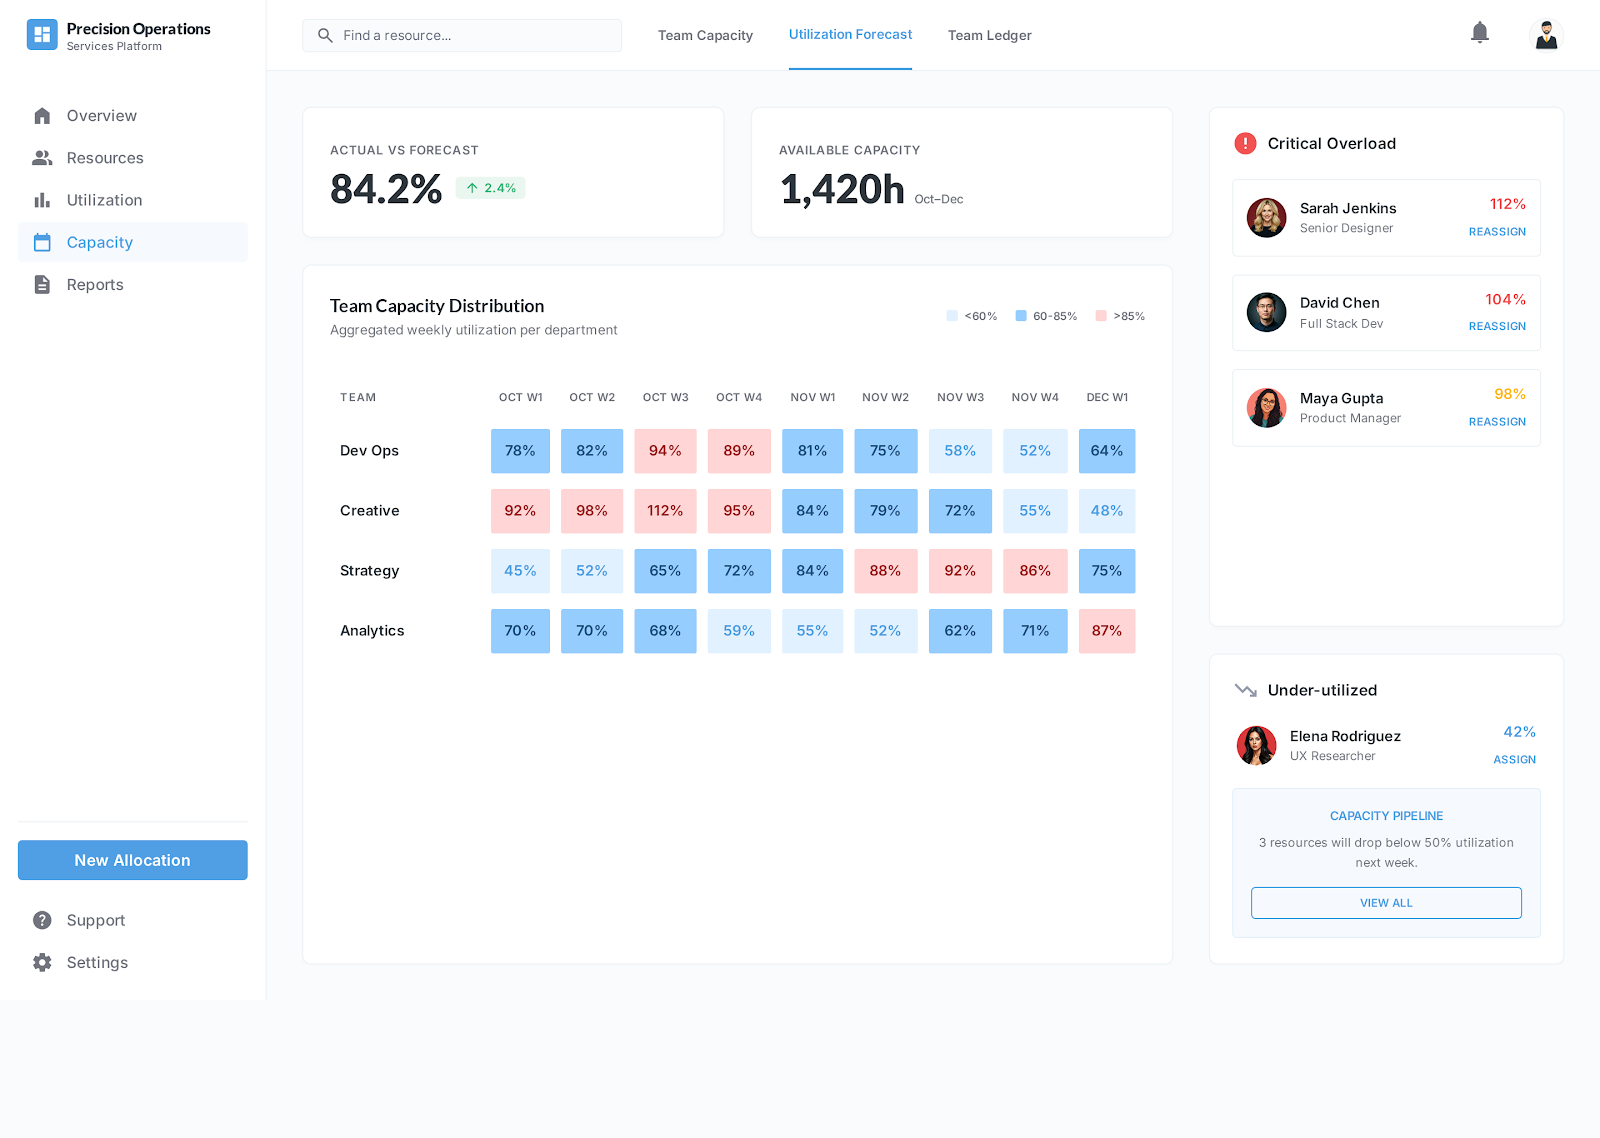
Team Capacity
Allocation heatmap per team, over- and under-utilization alerts.
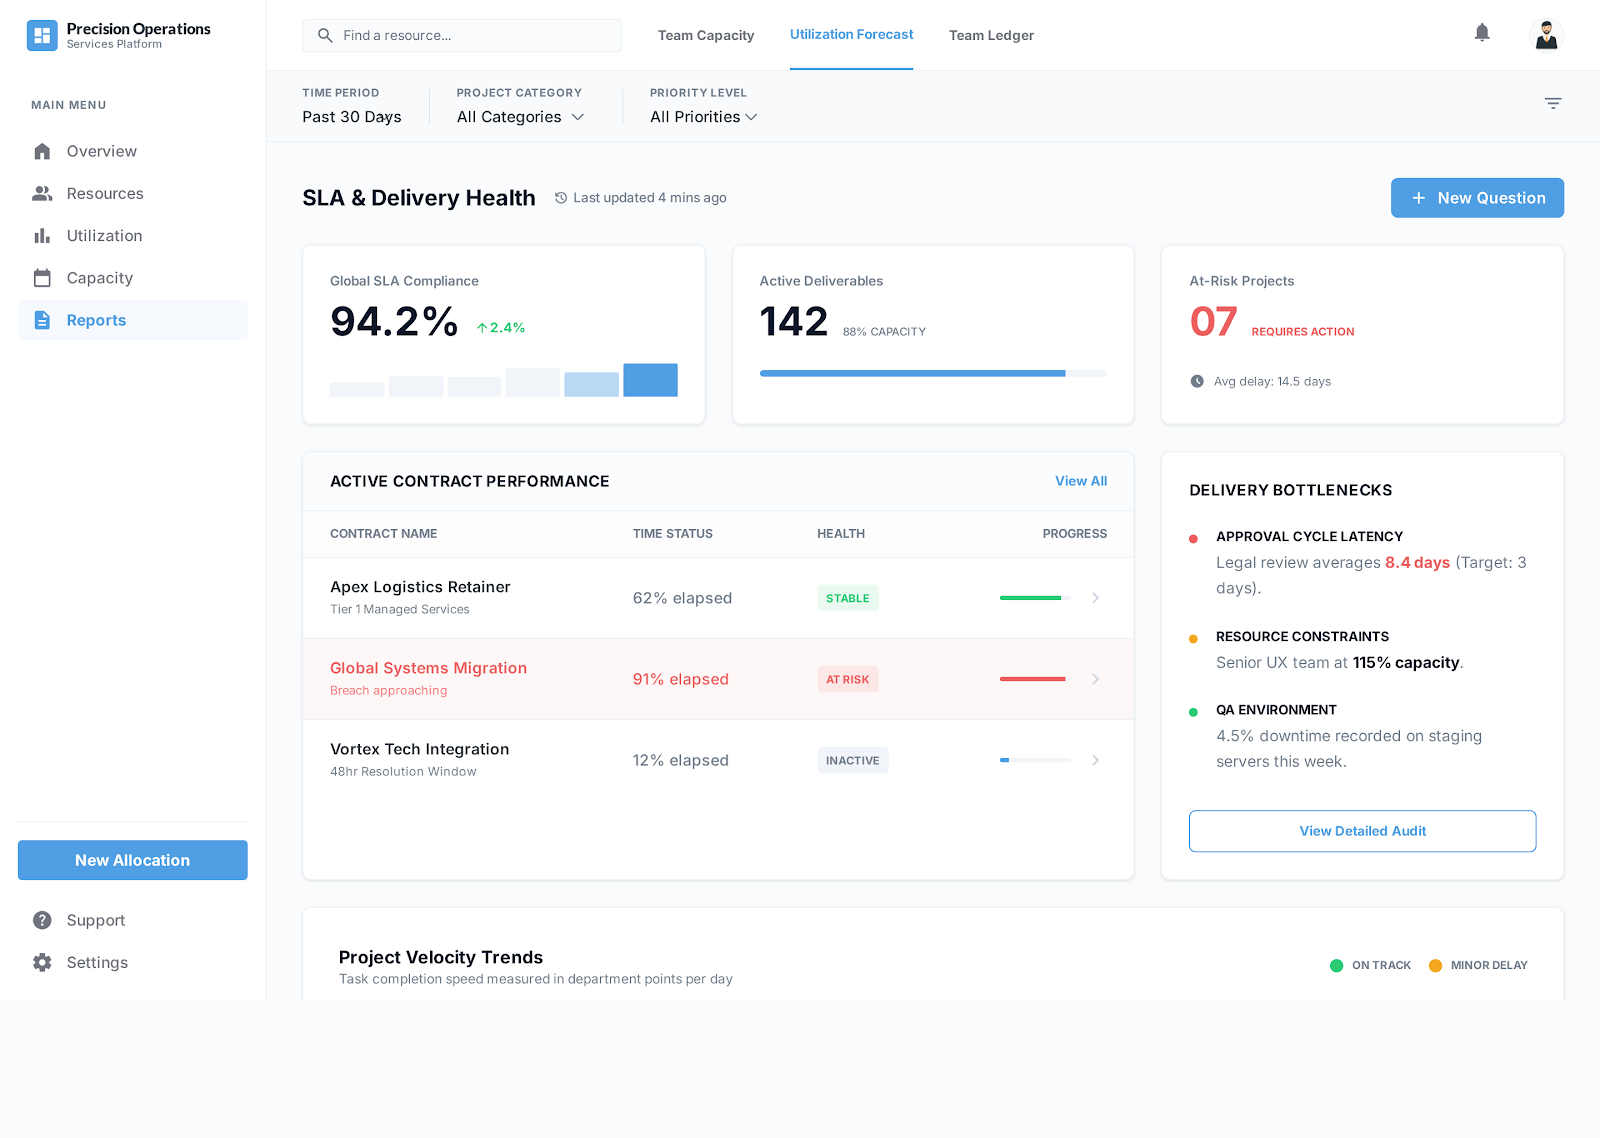
Delivery Health
SLA performance, bottlenecks, project velocity trends.
04 / Process
How I work
From first call to running operations dashboards.
Discovery call
A 30-minute conversation. You tell me what you can't see — utilization, margins, pipeline. I tell you where in the chain the problem sits.
Analysis
I map your current systems: time tracking, CRM, accounting, project tools. Where do the gaps sit? Why don't the numbers match?
Solution
I walk you through the approach — what to build, in what order, and why. You understand the trade-offs before we start.
Proposal
Clear scope, timeline, transparent pricing. No surprises.
Build
I build it. You see progress weekly. Every pipeline, every model, every dashboard ties back to the operational question we agreed on in step 1.
Three ways to get your operations under control
| Xudo | In-house specialist | SaaS tool | |
|---|---|---|---|
| Cost | €20-60K all-in | €80-100K+ / year | Grows with revenue |
| Time to value | Weeks, not months | 3-6 months ramp-up | Fast, but no guidance |
| Expertise | 20 years, full chain | One person's experience | None — it's a tool |
| Strategic input | I challenge assumptions first | Depends on the person | Zero |
| Flexibility | Cancel after month one | Notice periods, risk | High, but you're alone |
If you need someone in the office every day, hire a BI manager. If you already know what you need, buy the tool. If you need operations dashboards that connect your time tracking, CRM, and accounting — done right the first time — that's what I do.
Two ways to work with me
Project
I build your operations dashboard and hand it over. Your team maintains it.
- One-time investment (€20-50K)
- Delivered in 2-6 months
- Full documentation and handover
- You own and maintain the system
Managed
I build your operations dashboard and keep it running. You do nothing technical.
- Setup + monthly fee (from €1,000/mo)
- Same build quality as a project
- Monitoring, maintenance, strategy calls included
- I handle everything — you steer the business
Not sure which fits? Most firms start with a project. If you'd rather not maintain it internally, Managed BI is the better fit.
Predictable investment.
Fixed-scope, fixed-price. You pay for the outcome — a working operations dashboard — not for hours spent. No agency overhead, no surprises.
Foundation BI Setup
For firms ready to move beyond spreadsheets
- 1-2 core data sources
- Essential dashboards
- Central data warehouse with automated data flows
- Go live in 2-3 months
Full Business Intelligence
For firms connecting multiple operational systems
- 3-5 data sources
- Comprehensive dashboards
- Automated data flows + data freshness monitoring
- ~90% reporting reduction
- Go live in 3-4 months
Full Operations Platform
For multi-office or multi-entity firms
- 5+ data sources
- Advanced analytics
- Automated data flows + freshness monitoring + semantic layer
- Custom integrations
- Go live in 4-6 months
All collaborations start with a trial period. After the first month you can cancel with 1 month notice. No long-term contracts, no vendor lock-in. This means I must deliver value from day one - exactly as it should be.
Need help outside a project scope? Extra dashboards, new data sources, one-off analyses — available at €1,250 / day for existing and new clients.
Not sure where to start?
Book a free 30-minute call. We'll talk through your operational challenges and I'll tell you honestly whether I can help.
Check Availability